Dehcho Region
Administrative region in Northwest Territories, Canada
Dehcho Region communities in the Northwest Territories
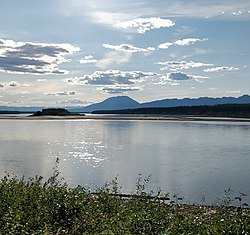
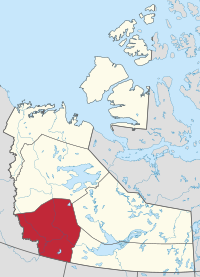
The Dehcho Region [pronunciation? or Deh Cho is one of five administrative regions in the Northwest Territories of Canada. According to Municipal and Community Affairs the region consists of six communities with the regional office situated in Fort Simpson .[ 1] Dehcho First Nations .[ 4] [ 5]
Communities
The Dehcho Region includes the following communities:
Historical population Year 2001 2,293 — 2002 2,300 +0.3% 2003 2,258 −1.8% 2004 2,243 −0.7% 2005 2,251 +0.4% 2006 2,283 +1.4% 2007 2,230 −2.3% 2008 2,226 −0.2% 2009 2,253 +1.2% 2010 2,252 −0.0%
Year 2011 2,231 −0.9% 2012 2,231 +0.0% 2013 2,213 −0.8% 2014 2,237 +1.1% 2015 2,277 +1.8% 2016 2,269 −0.4% 2017 2,264 −0.2% 2001 2,293 +1.3% 2017 2,264 −1.3%
Sources: NWT Bureau of Statistics (2001 - 2017)[ 10]
Communities of the Dehcho Region
Communities of the Dehcho Region
Former Roman Catholic church at Fort Liard (2011)
Dehcho First Nations office building at Fort Simpson (2011)
Jean Marie River (2007)
Nahanni Butte Band Office (2006)
Sambaa K'e (2006)
The S.S. Mackenzie River and three barges tied up at Fort Wrigley in 1946
Climate
Climate data for Fort Liard (Fort Liard Airport )60°14′06″N 123°28′01″W / 60.23500°N 123.46694°W / 60.23500; -123.46694 (Fort Liard Airport ) [ c]
Month
Jan
Feb
Mar
Apr
May
Jun
Jul
Aug
Sep
Oct
Nov
Dec
Year
Record high humidex
14.7
14.1
19.8
22.9
31.7
35.5
42.6
38.7
32.1
26.6
13.3
14.3
42.6
Record high °C (°F)
14.8
15.0
19.9
25.0
32.6
35.2
35.2
34.9
30.5
26.5
13.5
15.3
35.2
Mean daily maximum °C (°F)
−16.7
−10.1
−2.4
8.8
17.4
22.0
23.7
21.6
15.3
4.8
−8.8
−15.4
5.0
Daily mean °C (°F)
−20.8
−15.7
−9.4
2.0
10.3
15.4
17.6
15.5
9.6
0.7
−12.5
−19.3
−0.6
Mean daily minimum °C (°F)
−24.9
−21.3
−16.3
−4.7
3.2
8.8
11.4
9.4
3.9
−3.4
−16.3
−23.1
−6.1
Record low °C (°F)
−46.7
−44.0
−38.3
−30.5
−14.5
−1.6
−0.1
−1.7
−11.7
−30.0
−43.0
−45.0
−46.7
Record low wind chill
−61.6
−51.9
−46.6
−34.3
−22.3
−3.9
0.0
0.0
−10.7
−32.4
−50.9
−53.2
−61.6
Average precipitation mm (inches)
27.0
19.3
15.2
15.9
39.5
71.3
82.2
54.0
43.4
27.4
31.0
22.9
449.2
Average rainfall mm (inches)
0.0
0.0
0.1
3.3
37.2
61.1
88.0
50.5
45.4
10.8
0.1
0.0
296.4
Average snowfall cm (inches)
30.5
22.8
17.0
12.2
1.9
0.0
0.0
0.0
2.0
16.8
35.4
26.7
165.3
Average precipitation days (≥ 0.2 mm)
9.2
7.7
7.0
4.9
9.8
10.7
12.3
12.2
10.9
8.6
10.1
8.1
111.3
Average rainy days (≥ 0.2 mm)
0.0
0.0
0.1
1.8
8.9
9.7
11.5
10.8
10.8
3.9
0.1
0.0
57.4
Average snowy days (≥ 0.2 cm)
9.0
7.4
7.5
3.2
1.0
0.0
0.0
0.0
0.8
5.4
10.1
7.4
51.8
Average relative humidity (%) (at 1500 LST )
70.9
62.9
49.6
40.7
37.4
46.7
49.8
51.3
53.0
66.4
74.9
74.8
56.6
Source: Environment and Climate Change Canada [ 11] [ 12] [ 13]
Climate data for Fort Simpson (Fort Simpson Airport )WMO ID : 71946; coordinates 61°45′37″N 121°14′12″W / 61.76028°N 121.23667°W / 61.76028; -121.23667 (Fort Simpson Airport ) [ d]
Month
Jan
Feb
Mar
Apr
May
Jun
Jul
Aug
Sep
Oct
Nov
Dec
Year
Record high humidex
12.0
13.9
16.5
26.4
31.8
35.8
41.3
39.7
32.2
24.0
11.3
14.0
41.3
Record high °C (°F)
13.2
15.6
17.2
25.5
32.8
35.0
36.6
35.4
30.9
30.6
13.3
14.5
36.6
Mean daily maximum °C (°F)
−19.3
−14.2
−6.0
5.7
15.9
21.9
23.8
21.1
14.1
2.4
−10.6
−17.5
3.1
Daily mean °C (°F)
−23.6
−19.5
−12.5
−0.5
9.3
15.6
17.7
15.1
8.5
−1.4
−14.5
−21.6
−2.3
Mean daily minimum °C (°F)
−27.8
−24.7
−19.1
−6.7
2.8
9.2
11.5
9.0
2.9
−5.1
−18.4
−25.7
−7.7
Record low °C (°F)
−54.4
−56.2
−46.7
−39.4
−22.8
−2.2
−1.1
−6.1
−20.6
−27.8
−46.1
−53.3
−53.3
Record low wind chill
−58.9
−54.8
−48.5
−44.3
−24.7
−5.9
−2.7
−4.9
−23.7
−35.5
−53.2
−59.6
−59.6
Average precipitation mm (inches)
18.1
16.2
14.8
15.5
30.3
55.8
56.5
59.5
32.4
31.9
22.3
17.4
370.5
Average rainfall mm (inches)
0.1
0.1
0.2
1.5
23.8
57.2
59.2
64.5
31.3
12.1
0.2
0.0
249.9
Average snowfall cm (inches)
30.9
25.6
20.0
17.8
8.1
0.6
0.0
0.0
3.9
24.1
36.4
27.8
195.2
Average precipitation days (≥ 0.2 mm)
12.6
11.0
9.5
6.1
8.5
11.7
12.0
11.8
10.4
12.1
11.9
11.7
129.0
Average rainy days (≥ 0.2 mm)
0.2
0.1
0.3
1.0
7.2
11.0
12.0
11.6
9.8
4.6
0.3
0.0
58.1
Average snowy days (≥ 0.2 cm)
12.6
11.6
9.6
4.9
2.2
0.1
0.0
0.1
1.4
8.7
12.8
12.3
76.0
Average relative humidity (%) (at 1500 LST )
78.4
75.3
66.1
50.6
41.2
44.9
49.9
53.6
58.2
76.4
82.4
80.2
63.1
Mean monthly sunshine hours
55.7
95.1
180.6
248.6
293.4
313.0
307.1
263.8
163.9
77.8
49.4
30.0
2,078.3
Percent possible sunshine
28.5
38.0
49.6
56.3
53.8
53.7
53.3
53.4
42.0
25.0
22.8
17.7
41.2
Source: Environment and Climate Change Canada [ 15] [ 16] [ 17] [ 18] [ 19] [ 20] [ 21] [ 22] [ 23] [ 24] [ 25] [ 26] [ 27] [ 28] [ 14]
Climate data for Wrigley (Wrigley Airport )63°12′34″N 123°26′12″W / 63.20944°N 123.43667°W / 63.20944; -123.43667 (Wrigley Airport ) [ e]
Month
Jan
Feb
Mar
Apr
May
Jun
Jul
Aug
Sep
Oct
Nov
Dec
Year
Record high humidex
11.2
10.0
18.8
24.0
30.4
38.1
37.9
36.9
29.8
21.3
7.2
11.0
38.1
Record high °C (°F)
6.5
11.1
19.0
25.0
34.0
37.0
35.5
33.5
28.3
21.7
8.9
11.7
37.0
Mean daily maximum °C (°F)
−21.1
−17.1
−7.9
5.0
14.6
21.7
23.4
19.9
12.5
−0.3
−14.8
−18.6
1.5
Daily mean °C (°F)
−25.4
−22.1
−15.0
−1.7
8.0
15.0
16.9
13.6
7.1
−3.8
−18.7
−22.7
−4.1
Mean daily minimum °C (°F)
−29.7
−27.2
−22.1
−8.3
1.3
8.2
10.3
7.2
1.6
−7.4
−22.5
−26.7
−9.6
Record low °C (°F)
−51.7
−53.3
−46.7
−36.1
−20.9
−3.9
−1.1
−6.0
−18.0
−31.5
−48.0
−49.4
−53.3
Record low wind chill
−54.6
−52.7
−48.3
−39.4
−25.5
−1.9
−1.6
−3.2
−13.3
−28.5
−49.1
−57.7
−57.7
Average precipitation mm (inches)
16.7
14.6
10.4
8.1
22.0
43.5
64.0
49.5
35.9
29.4
20.5
18.1
332.6
Average rainfall mm (inches)
0.0
0.0
0.0
0.3
18.4
43.5
64.0
49.5
32.3
7.6
0.0
0.0
215.5
Average snowfall cm (inches)
19.1
15.4
10.9
8.9
3.8
0.0
0.0
0.0
3.4
21.8
22.6
18.9
124.7
Average precipitation days (≥ 0.2 mm)
8.0
6.4
5.6
3.3
6.4
8.4
9.7
9.0
9.2
9.7
9.0
7.5
92.1
Average rainy days (≥ 0.2 mm)
0.0
0.0
0.0
0.4
5.6
8.2
9.7
9.0
8.3
2.2
0.1
0.0
43.3
Average snowy days (≥ 0.2 cm)
8.0
6.4
5.6
2.9
1.1
0.0
0.0
0.0
1.1
7.9
9.1
7.5
49.4
Source: Environment and Climate Change Canada (1981-2010 normals)[ 29] [ 30]
References
References
^ a b c Dehcho Region ^ a b "Population and dwelling counts, for Canada, provinces and territories, and census subdivisions (municipalities), 2021 and 2016 censuses – 100% data" . Statistics Canada . 8 December 2024. Retrieved 8 December 2024 .^ Government of the Northwest Territories. "About Municipal and Community Affairs" . Retrieved 17 June 2019 . ^ Communities - Deh Cho ^ Some government departments, such as the Bureau of Statistics, also include Fort Providence, Hay River Dene 1 and Kakisa. However, Municipal and Community Affairs indicates they are part of the South Slave Region
^ "Northwest Territories Official Community Names and Pronunciation Guide" . Prince of Wales Northern Heritage Centre Archived from the original on 13 January 2016. Retrieved 13 January 2016 .^ "Indigenous Population Profile, 2021 Census of Population" . Statistics Canada. 16 June 2023. Retrieved 8 December 2024 .^ "Differences in Community Government Structures" (PDF) . Maca.gov.nt.ca. Retrieved 18 December 2014 .^ "List of municipalities - Northwest Territories" . Canada Revenue Agency . 16 June 2015. Retrieved 10 December 2024 .^ Population Estimates By Community from the GNWT^ "Fort Liard (composite station data)" . Canadian Climate Normals 1991–2020 . Environment and Climate Change Canada . 1 October 2024. Retrieved 10 December 2024 .^ "Daily Data Report for June 2021" . Canadian Climate Data . Environment and Climate Change Canada. 31 October 2011. Retrieved 9 July 2021 .^ "Daily Data Report for August 1999 Fort Liard" . Canadian Climate Data . Environment and Climate Change Canada. 1 October 2024. Retrieved 10 December 2024 .^ a b "Fort Simpson A" . Canadian Climate Normals 1991–2020 . Environment and Climate Change Canada. 1 October 2024. WMO ID : 71946. Retrieved 10 December 2024 .^ "Fort Simpson A" . Canadian Climate Normals 1991–2020 . Environment and Climate Change Canada . 1 October 2024. WMO ID : 71946. Retrieved 10 December 2024 .^ "Daily Data Report for January 1936 Fort Simpson" . Canadian Climate Data . Environment and Climate Change Canada. 1 October 2024. Climate ID: 2202100. Retrieved 10 December 2024 .^ "Daily Data Report for February 1938 Fort Simpson" . Canadian Climate Data . Environment and Climate Change Canada. 1 October 2024. Climate ID: 2202100. Retrieved 10 December 2024 .^ "Daily Data Report for February 1947 Fort Simpson" . Canadian Climate Data . Environment and Climate Change Canada. 1 October 2024. Climate ID: 2202100. Retrieved 10 December 2024 .^ "Daily Data Report for March 1929 Fort Simpson" . Canadian Climate Data . Environment and Climate Change Canada. 1 October 2024. Climate ID: 2202100. Retrieved 10 December 2024 .^ "Daily Data Report for April 1954 Fort Simpson" . Canadian Climate Data . Environment and Climate Change Canada. 1 October 2024. Climate ID: 2202100. Retrieved 10 December 2024 .^ "Daily Data Report for May 1899 Fort Simpson" . Canadian Climate Data . Environment and Climate Change Canada. 1 October 2024. Climate ID: 2202100. Retrieved 10 December 2024 .^ "Daily Data Report for June 1955 Fort Simpson" . Canadian Climate Data . Environment and Climate Change Canada. 1 October 2024. Climate ID: 2202100. Retrieved 10 December 2024 .^ "Daily Data Report for August 19229 Fort Simpson" . Canadian Climate Data . Environment and Climate Change Canada. 1 October 2024. Climate ID: 2202100. Retrieved 10 December 2024 .^ "Daily Data Report for October Fort Simpson" . Canadian Climate Data . Environment and Climate Change Canada. 1 October 2024. Climate ID: 2202100. Retrieved 10 December 2024 .^ "Daily Data Report for October 1935 Fort Simpson" . Canadian Climate Data . Environment and Climate Change Canada. 1 October 2024. Climate ID: 2202100. Retrieved 10 December 2024 .^ "Daily Data Report for November 1941 Fort Simpson" . Canadian Climate Data . Environment and Climate Change Canada. 1 October 2024. Climate ID: 2202100. Retrieved 10 December 2024 .^ "Daily Data Report for November 1949 Fort Simpson" . Canadian Climate Data . Environment and Climate Change Canada. 1 October 2024. Climate ID: 2202100. Retrieved 10 December 2024 .^ "Daily Data Report for December 1933 Fort Simpson" . Canadian Climate Data . Environment and Climate Change Canada. 1 October 2024. Climate ID: 2202100. Retrieved 10 December 2024 .^ "Wrigley A" . Canadian Climate Normals 1981–2010 . Environment and Climate Change Canada . Climate ID: 2204000. Archived from the original on 13 March 2020. Retrieved 10 December 2024 .^ "Wrigley A" . Canadian Climate Normals 1991–2020 . Environment and Climate Change Canada. 1 October 2024. Climate ID: 2204005. Retrieved 10 December 2024 .
External links
Places adjacent to Dehcho Region
61°51′47″N 121°21′18″W / 61.86306°N 121.35500°W / 61.86306; -121.35500 (Dehcho Region centred on Fort Simpson )


