RA plot
The ratio average (RA) plot is an integer-based version of an MA plot for visualizing two-condition count data. Its distinctive arrow-like shape derives from the way it includes condition-unique (0,n) or (n,0) points into the plot via an epsilon factor.
Definition
An RA plot, like its cousin, the MA plot, is a re-scaled and (45-degree) rotated version of a simple two-dimensional scatter plot of a versus b where a and b are equal-length vectors of positive measurements. This rescaling and rotation allows for better visibility and emphasis of important outliers points that vary between the two measurement conditions.[1] Essentially it is a plot of the log ratio [R] vs the average log [A] of each pairing of the elements of a and b. Unlike an MA plot, however, because the RA plot takes non-negative integer counts as input, it must employ work-arounds to include mathematically invisible points (such as points where one or both element(s) of the pair is zero).
If we modify our original a (or b) vector via:
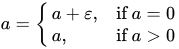
where

then R and A can be defined as:
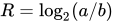
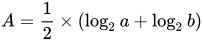
R, like M, is plotted on the y-axis and represents a log (fold change) ratio between a and b. A is plotted on the x-axis and represents the average abundance for a coordinate pair. The RA plot provides a quick overview of the distribution and size of a dataset consisting of non-zero counts.
Etymology
The acronym prefix "R.A." is sometimes pronounced as the one syllable word "ray" because of the plot's strong resemblance to a geometric ray. This characteristic arrow-like shape derives from two key features: on the right at the vector origin, a long asymptotic tail, and on the left (forming the arrow head) two (often dense) patches of condition-unique points.
Work-arounds for point visibility and inclusion
Condition unique points
Because a large portion of the pairs of a and b contain zeros in one or both conditions, they are impossible to plot as-is on a log scale. Other MA plotting functions artificially include these condition-unique points in the plot by spreading them vertically as a "smear" on the left or horizontally as a "rug" at the very top and bottom of the plot. In an RA plot, by contrast, the uniques are included via addition a small epsilon factor (between .1 and .5) which places them in a more statistically appropriate location in the plot.


Overplotting
Another problem with plotting this (or any) type of count data is overplotting which is solved in the RA plot by jittering the points out away from each other but no so far as to merge with other coordinates. The result of this feature is a patchwork-like appearance to the plot that fades away as the A increases.


Packages
The caroline CRAN R package contains the only known implementation of an RA plot. However, the meta-transcriptomics "manta" R package provides a wrapper around this RA plot implementation and is used for assessing fold change in transcription of genes (the points) while simultaneously visualizing each gene's taxonomic distributions as individual pie chart points.[2]
Examples
library(caroline)
a <- rnbinom(n=10000, mu=5, size=2)
b <- rnbinom(n=10000, mu=5, size=2)

raPlot(a, b)
References
- ^ Dudoit, S, Yang, YH, Callow, MJ, Speed, TP. (2002). Statistical methods for identifying differentially expressed genes in replicated cDNA microarray experiments. Stat. Sin. 12:1 111–139
- ^ Schruth, D. & Marchetti, A. (2011). Microbial Assemblage Normalized Transcript Analysis. R package version 0.9.5.
See also
Content Disclaimer
Informasi ini disarikan dari Wikipedia dan disajikan kembali untuk tujuan edukasi. Konten tersedia di bawah lisensi CC BY-SA 3.0. Kami tidak bertanggung jawab atas ketidakakuratan data yang bersumber dari kontribusi publik tersebut.
- The information displayed on this website is sourced in part or in whole from Wikipedia and has been adapted for the purpose of restating it. We strive to provide accurate and relevant information, however:
- There is no guarantee of absolute accuracy. Wikipedia is an open, collaborative project that can be edited by anyone, so information is subject to change.
- It is not intended to constitute professional advice. The content displayed is for informational and educational purposes only. For important decisions (e.g., medical, legal, or financial), please consult a professional.
- Content copyright. Wikipedia is licensed under the Creative Commons Attribution-ShareAlike License (CC BY-SA). This means that content may be reused with appropriate attribution and shared under a similar license.
- Responsible use. Any risk arising from the use of information from this website is entirely the responsibility of the user.