|
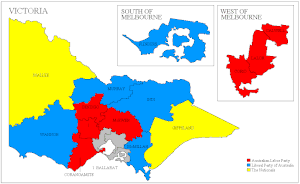
Results of the 2010 Australian federal election in Victoria
2010 Australian federal election
(Victoria)|
|
|
|
|
 Winning Party by Electorate
  First Preference Vote
  Two-Candidate Preferred Vote
 |
This is a list of electoral division results for the Australian 2010 federal election in the state of Victoria.[1][2]
Overall
 Electoral divisions: Victoria Electoral divisions: Victoria
 Electoral divisions: Melbourne area Electoral divisions: Melbourne area
Turnout 93.46% (CV) — Informal 4.50%
| Party
|
Votes
|
%
|
Swing
|
Seats
|
Change
|
|
|
Australian Labor Party
|
1,361,416
|
42.81
|
–1.88
|
22
|
 1 1
|
|
|
|
Liberal
|
1,159,301
|
36.45
|
–1.64
|
12
|
 2 2
|
|
|
National
|
101,419
|
3.19
|
+0.17
|
2
|

|
| Coalition
|
1,260,720
|
39.64
|
–1.47
|
14
|
 2 2
|
|
|
Australian Greens
|
402,482
|
12.66
|
+4.49
|
1
|
 1 1
|
|
|
Family First Party
|
99,747
|
3.14
|
+0.12
|
|
|
|
|
Independents
|
26,525
|
0.83
|
−0.17
|
|
|
|
|
Liberal Democratic Party
|
7,839
|
0.25
|
+0.15
|
|
|
|
|
Australian Sex Party
|
6,023
|
0.19
|
+0.19
|
|
|
|
|
Secular Party of Australia
|
5,239
|
0.16
|
+0.16
|
|
|
|
|
Australian Democrats
|
3,947
|
0.12
|
−1.10
|
|
|
|
|
Socialist Alliance
|
2,225
|
0.07
|
+0.00
|
|
|
|
|
Socialist Equality Party
|
1,656
|
0.05
|
+0.03
|
|
|
|
|
Citizens Electoral Council
|
922
|
0.03
|
−0.24
|
|
|
|
|
Christian Democratic Party
|
632
|
0.02
|
−0.02
|
|
|
|
|
Australia First Party
|
295
|
0.01
|
+0.01
|
|
|
|
|
Others
|
516
|
0.02
|
+0.00
|
|
|
| Total
|
3,180,184
|
|
|
37
|
|
| Two-party-preferred vote
|
|
|
Australian Labor Party
|
1,758,982
|
55.31
|
+1.04
|
22
|
 1 1
|
|
|
Liberal/National Coalition
|
1,421,202
|
44.69
|
–1.04
|
14
|
 2 2
|
|
|
| Invalid/blank votes
|
149,699
|
4.50
|
+1.25
|
|
|
| Registered voters/turnout
|
3,561,873
|
93.49
|
|
|
|
| Source: Commonwealth Election 2010
| Results by division
Aston
Ballarat
Batman
Bendigo
Bruce
Calwell
Casey
Chisholm
Corangamite
Corio
Deakin
Dunkley
Flinders
Gellibrand
Gippsland
Goldstein
Gorton
Higgins
Holt
Hotham
Indi
Isaacs
Jagajaga
Kooyong
Lalor
La Trobe
Mallee
Maribyrnong
McEwen
McMillan
Melbourne
Melbourne Ports
Menzies
Murray
Scullin
Wannon
Wills
See also
References
|


