Cobweb plot
 | This article has multiple issues. Please help improve it or discuss these issues on the talk page. (Learn how and when to remove these messages)
|




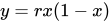

A cobweb plot, known also as Lémeray Diagram or Verhulst diagram is a visual tool used in dynamical systems, a field of mathematics to investigate the qualitative behaviour of one-dimensional iterated functions, such as the logistic map. The technique was introduced in 1822 by Adrien-Marie Legendre.[1] Using a cobweb plot, it is possible to infer the long-term status of an initial condition under repeated application of a map.[2]
Method
For a given iterated function , the plot consists of a diagonal () line and a curve representing . To plot the behaviour of a value , apply the following steps.


- Find the point on the function curve with an x-coordinate of . This has the coordinates ().
- Plot horizontally across from this point to the diagonal line. This has the coordinates ().
- Plot vertically from the point on the diagonal to the function curve. This has the coordinates ().
- Repeat from step 2 as required.



Interpretation
On the Lémeray diagram, a stable fixed point corresponds to the segment of the staircase with progressively decreasing stair lengths or to an inward spiral, while an unstable fixed point is the segment of the staircase with growing stairs or an outward spiral. It follows from the definition of a fixed point that the staircases converge whereas spirals center at a point where the diagonal line crosses the function graph. A period-2 orbit is represented by a rectangle, while greater period cycles produce further, more complex closed loops. A chaotic orbit would show a "filled-out" area, indicating an infinite number of non-repeating values.[2]

See also
- Jones diagram – similar plotting technique
- Fixed-point iteration – iterative algorithm to find fixed points (produces a cobweb plot)
References
- ^ Rosa, Alessandro (2021). "An episodic history of the staircased iteration diagram". Antiquitates Mathematicae. 15: 3–90. doi:10.14708/am.v15i1.7056.
- ^ a b Stoop, Ruedi; Steeb, Willi-Hans (2006). Berechenbares Chaos in dynamischen Systemen [Computable Chaos in dynamic systems] (in German). Birkhäuser Basel. p. 8. doi:10.1007/3-7643-7551-5. ISBN 978-3-7643-7551-5.
External links

 | This mathematical physics–related article is a stub. You can help Wikipedia by adding missing information. |
Content Disclaimer
Informasi ini disarikan dari Wikipedia dan disajikan kembali untuk tujuan edukasi. Konten tersedia di bawah lisensi CC BY-SA 3.0. Kami tidak bertanggung jawab atas ketidakakuratan data yang bersumber dari kontribusi publik tersebut.
- The information displayed on this website is sourced in part or in whole from Wikipedia and has been adapted for the purpose of restating it. We strive to provide accurate and relevant information, however:
- There is no guarantee of absolute accuracy. Wikipedia is an open, collaborative project that can be edited by anyone, so information is subject to change.
- It is not intended to constitute professional advice. The content displayed is for informational and educational purposes only. For important decisions (e.g., medical, legal, or financial), please consult a professional.
- Content copyright. Wikipedia is licensed under the Creative Commons Attribution-ShareAlike License (CC BY-SA). This means that content may be reused with appropriate attribution and shared under a similar license.
- Responsible use. Any risk arising from the use of information from this website is entirely the responsibility of the user.