|
Debugger
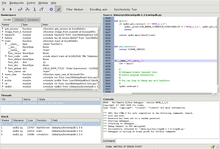
 A debugger is a computer program used to test and debug other programs (the "target" programs). Common features of debuggers include the ability to run or halt the target program using breakpoints, step through code line by line, and display or modify the contents of memory, CPU registers, and stack frames. The code to be examined might alternatively be running on an instruction set simulator (ISS), a technique that allows great power in its ability to halt when specific conditions are encountered, but which will typically be somewhat slower than executing the code directly on the appropriate (or the same) processor. Some debuggers offer two modes of operation, full or partial simulation, to limit this impact. A "trap" occurs when the program cannot normally continue because of a programming bug or invalid data. For example, the program might have tried to use an instruction not available on the current version of the CPU or attempted to access unavailable or protected memory. When the program "traps" or reaches a preset condition, the debugger typically shows the location in the original code if it is a source-level debugger or symbolic debugger, commonly now seen in integrated development environments. If it is a low-level debugger or a machine-language debugger it shows the line in the disassembly (unless it also has online access to the original source code and can display the appropriate section of code from the assembly or compilation). FeaturesTypically, debuggers offer a query processor, a symbol resolver, an expression interpreter, and a debug support interface at its top level.[1] Debuggers also offer more sophisticated functions such as running a program step by step (single-stepping or program animation), stopping (breaking) (pausing the program to examine the current state) at some event or specified instruction by means of a breakpoint, and tracking the values of variables.[2] Some debuggers have the ability to modify the program state while it is running. It may also be possible to continue execution at a different location in the program to bypass a crash or logical error. The same functionality which makes a debugger useful for correcting bugs allows it to be used as a software cracking tool to evade copy protection, digital rights management, and other software protection features. It often also makes it useful as a general verification tool, fault coverage, and performance analyzer, especially if instruction path lengths are shown.[3] Early microcomputers with disk-based storage often benefitted from the ability to diagnose and recover corrupted directory or registry data records, to "undelete" files marked as deleted, or to crack file password protection. Most mainstream debugging engines, such as gdb and dbx, provide console-based command line interfaces. Debugger front-ends are popular extensions to debugger engines that provide IDE integration, program animation, and visualization features. Record and replay debuggingRecord and replay debugging,[4] also known as "software flight recording" or "program execution recording", captures application state changes and stores them to disk as each instruction in a program executes. The recording can then be replayed over and over, and interactively debugged to diagnose and resolve defects. Record and replay debugging is very useful for remote debugging and for resolving intermittent, non-deterministic, and other hard-to-reproduce defects. Reverse debuggingSome debuggers include a feature called "reverse debugging", also known as "historical debugging" or "backwards debugging". These debuggers make it possible to step a program's execution backwards in time. Various debuggers include this feature. Microsoft Visual Studio (2010 Ultimate edition, 2012 Ultimate, 2013 Ultimate, and 2015 Enterprise edition) offers IntelliTrace reverse debugging for C#, Visual Basic .NET, and some other languages, but not C++. Reverse debuggers also exist for C, C++, Java, Python, Perl, and other languages. Some are open source; some are proprietary commercial software. Some reverse debuggers slow down the target by orders of magnitude, but the best reverse debuggers cause a slowdown of 2× or less. Reverse debugging is very useful for certain types of problems, but is still not commonly used yet.[5] Time Travel debuggingIn addition to the features of reverse debuggers, time travel debugging also allow users to interact with the program, changing the history if desired, and watch how the program responds. Language dependencySome debuggers operate on a single specific language while others can handle multiple languages transparently. For example, if the main target program is written in COBOL but calls assembly language subroutines and PL/1 subroutines, the debugger may have to dynamically switch modes to accommodate the changes in language as they occur. Memory protectionSome debuggers also incorporate memory protection to avoid storage violations such as buffer overflow. This may be extremely important in transaction processing environments where memory is dynamically allocated from memory 'pools' on a task by task basis. Hardware support for debuggingMost modern microprocessors have at least one of these features in their CPU design to make debugging easier:
Debugger front-endsSome of the most capable and popular debuggers implement only a simple command line interface (CLI)—often to maximize portability and minimize resource consumption. Developers typically consider debugging via a graphical user interface (GUI) easier and more productive.[citation needed] This is the reason for visual front-ends, that allow users to monitor and control subservient CLI-only debuggers via graphical user interface. Some GUI debugger front-ends are designed to be compatible with a variety of CLI-only debuggers, while others are targeted at one specific debugger. Ethical or legal debuggingDebugging is often used to illegally crack or pirate software, which is usually illegal even when done non-maliciously. Crackme's are programs specifically designed to be cracked or debugged. These programs allow those with debuggers to practice their debugging ability without getting into legal trouble. List of debuggersSome widely used debuggers are:
Earlier minicomputer debuggers include:
Mainframe debuggers include: See alsoReferencesCitations
Sources
External linksLook up debugger in Wiktionary, the free dictionary.
|