Oklahoma's 4th congressional district U.S. House district for Oklahoma
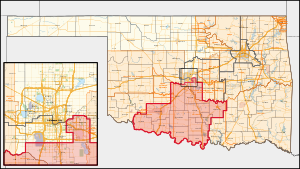
Oklahoma's 4th congressional district Interactive map of district boundaries since January 3, 2023
Representative Distribution Population (2023) 808,026 Median household $63,796[ 1] Ethnicity Cook PVI R+19[ 2]
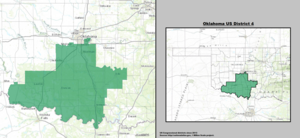
Oklahoma's 4th congressional district is located in south-central Oklahoma and covers (in whole or in part) a total of 15 counties. Its principal cities include Midwest City , Norman , Moore , Ada , Duncan , Lawton/Ft. Sill , and Ardmore . The district also includes much of southern Oklahoma City .
The district is currently represented by Republican Tom Cole .
Geography
The district borders Texas along the Red River to the south. To the north, the district includes a very small square-shaped portion of south-central Oklahoma County (enough to capture the city of Midwest City ) and then Cleveland , McClain , Grady , Garvin , Murray , Pontotoc , Comanche , Tillman , Cotton , Stephens , Jefferson , Carter , and Love counties.
History
As with the rest of the state, the district gives GOP candidates wide margins - George W. Bush received 61 percent of the vote in 2000, 67% in 2004, and John McCain received 66% of the vote in 2008. Mitt Romney received 67% in 2012, and Donald Trump received 66% and 65% in 2016 and 2020, respectively. The district is 63 percent urban, 5 percent Latino, and 3.5 percent foreign-born.[ 3]
Recent election results from statewide races
Composition
#
County
Seat
Population
19
Carter
Ardmore
48,596
27
Cleveland
Norman
301,193
31
Comanche
Lawton
121,574
33
Cotton
Walters
5,427
49
Garvin
Pauls Valley
25,865
51
Grady
Chickasha
57,375
67
Jefferson
Waurika
5,347
85
Love
Marietta
10,296
87
McClain
Purcell
47,072
99
Murray
Sulphur
13,754
109
Oklahoma
Oklahoma City
808,866
123
Pontotoc
Ada
38,396
137
Stephens
Duncan
44,014
141
Tillman
Frederick
6,869
Oklahoma City – 681,054Norman – 128,026Lawton – 90,381Moore – 62,793Midwest City – 58,408Ardmore – 24,725Duncan – 22,692Del City – 21,822Ada – 16,481Chickasha – 16,231Newcastle – 13,055
Blanchard – 8,879Tuttle – 7,413Noble – 6,985Purcell – 6,651Pauls Valley – 5,992Sulphur – 5,065Lone Grove – 4,993Marlow – 4,385Slaughterville – 4,163Elgin – 3,656Frederick – 3,468Cache – 2,930Lindsay – 2,864Davis – 2,823Marietta – 2,719Goldsby – 2,694
List of members representing the district
Name
Party
Years
Cong
Electoral history
Location
District established November 16, 1907
Charles D. Carter (Ardmore )
Democratic
November 16, 1907 –
60th 61st 62nd 63rd
Elected in 1907 .Re-elected in 1908 .Re-elected in 1910 .Re-elected in 1912 .3rd district
William H. Murray (Tishomingo )
Democratic
March 4, 1915 –
64th
Redistricted from the at-large district re-elected in 1914 .
Tom D. McKeown (Ada )
Democratic
March 4, 1917 –
65th 66th
Elected in 1916 .Re-elected in 1918 .
Joseph C. Pringey (Chandler )
Republican
March 4, 1921 –
67th
Elected in 1920 .
Tom D. McKeown (Ada )
Democratic
March 4, 1923 –
68th 69th 70th 71st 72nd 73rd
Again elected in 1922 .Re-elected in 1924 .Re-elected in 1926 .Re-elected in 1928 .Re-elected in 1930 .Re-elected in 1932 .
Percy Lee Gassaway (Coalgate )
Democratic
January 3, 1935 –
74th
Elected in 1934 .
Lyle Boren (Seminole )
Democratic
January 3, 1937 –
75th 76th 77th 78th 79th
Elected in 1936 .Re-elected in 1938 .Re-elected in 1940 .Re-elected in 1942 .Re-elected in 1944 .
Glen D. Johnson (Okemah )
Democratic
January 3, 1947 –
80th
Elected in 1946 .run for U.S. Senator .
Tom Steed (Shawnee )
Democratic
January 3, 1949 –
81st 82nd 83rd 84th 85th 86th 87th 88th 89th 90th 91st 92nd 93rd 94th 95th 96th
Elected in 1948 .Re-elected in 1950 .Re-elected in 1952 .Re-elected in 1954 .Re-elected in 1956 .Re-elected in 1958 .Re-elected in 1960 .Re-elected in 1962 .Re-elected in 1964 .Re-elected in 1966 .Re-elected in 1968 .Re-elected in 1970 .Re-elected in 1972 .Re-elected in 1974 .Re-elected in 1976 .Re-elected in 1978 .
Dave McCurdy (Norman )
Democratic
January 3, 1981 –
97th 98th 99th 100th 101st 102nd 103rd
Elected in 1980 .Re-elected in 1982 .Re-elected in 1984 .Re-elected in 1986 .Re-elected in 1988 .Re-elected in 1990 .Re-elected in 1992 .Retired to run for U.S. Senator .
J. C. Watts (Norman )
Republican
January 3, 1995 –
104th 105th 106th 107th
Elected in 1994 .Re-elected in 1996 .Re-elected in 1998 .Re-elected in 2000 .
Tom Cole (Moore )
Republican
January 3, 2003 –
108th 109th 110th 111th 112th 113th 114th 115th 116th 117th 118th 119th
Elected in 2002 .Re-elected in 2004 .Re-elected in 2006 .Re-elected in 2008 .Re-elected in 2010 .Re-elected in 2012 .Re-elected in 2014 .Re-elected in 2016 .Re-elected in 2018 .Re-elected in 2020 .Re-elected in 2022 .Re-elected in 2024 .
2003–2013
2013–2023
2023–present
Recent electoral history
Oklahoma's 4th congressional district [ 7] [ 8]
Year
Democratic
Votes
Pct
Republican
Votes
Pct
3rd Party
Party
Votes
Pct
4th Party
Party
Votes
Pct
1994
David Perryman
67,237
43%
√ J. C. Watts, Jr. 80,251
52%
Bill Tiffee
Independent
7,913
5%
1996
Ed Crocker
73,950
40%
√ J. C. Watts, Jr.
106,923
58%
Robert Murphy
Libertarian
4,500
2%
1998
Ben Odom
52,107
38%
√ J. C. Watts, Jr.
83,272
62%
2000
Larry Weatherford
54,808
31%
√ J. C. Watts, Jr.
114,000
65%
Susan Ducey
Reform
4,897
3%
Keith B. Johnson
Libertarian
1,979
1%
2002
Darryl Roberts
91,322
46.17%
√ Tom Cole
106,452
53.83%
2004
(no candidate)
√ Tom Cole
198,985
77.77%
Charlene K. Bradshaw
Independent
56,869
22.23%
2006
Hal Spake
64,775
35.39%
√ Tom Cole
118,266
64.61%
2008
Blake Cummings
79,674
29.21%
√ Tom Cole
180,080
66.02%
David E. Joyce
Independent
13,027
4.78%
2010 *
(no candidate)
√ Tom Cole
32,589
77.26%
RJ Harris
Republican
9,593
22.74%
2012
Donna Marie Bebo
71,155
27.60%
√ Tom Cole
176,561
67.89%
RJ Harris
Independent
11,725
4.51%
2014
Bert Smith
40,998
24.66%
√ Tom Cole
117,721
70.80%
Dennis B. Johnson
Independent
7,549
4.54%
2016
Christina Owen
76,412
26.10%
√ Tom Cole
204,143
69.60%
Sevier White
Libertarian
12,574
4.30%
2018
Mary Brannon
78,088
33.0%
√ Tom Cole
149,227
63.10%
Ruby Peters
Independent
9,323
3.90%
2020
Mary Brannon
90,459
28.80%
√ Tom Cole
213,096
67.80%
Bob White
Libertarian
10,803
3.40%
2022
Mary Brannon
74,667
33.25%
√ Tom Cole
149,879
66.75%
In 2010, no Democrat or independent candidate filed to run in the district. The results printed here are from the Republican primary, where the election was decided.
See also
References
35°N 98°W / 35°N 98°W / 35; -98


