1940 United States House of Representatives elections House elections for the 77th U.S. Congress
1940 United States House of Representatives elections
Majority party
Minority party
Leader
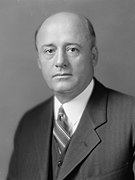
Sam Rayburn
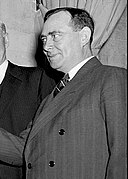
Joseph Martin
Party
Democratic
Republican
Leader since
September 16, 1940
January 3, 1939
Leader's seat
Texas 4th Massachusetts 14th
Last election
262 seats
169 seats
Seats won
267
162
Seat change
Popular vote
24,227,821
21,490,392
Percentage
51.4%
45.6%
Swing
Third party
Fourth party
Party
Progressive
American Labor
Last election
2 seats
1 seat
Seats won
3
1
Seat change
Popular vote
477,435
338,770
Percentage
1.0%
0.7%
Swing
Fifth party
Sixth party
Party
Farmer–Labor
Independent
Last election
1 seat
0 seats
Seats won
1
1
Seat change
Popular vote
298,250
113,497
Percentage
0.6%
0.2%
Swing
The 1940 United States House of Representatives elections were elections for the United States House of Representatives to elect members to serve in the 77th United States Congress . They were held for the most part on November 5, 1940, while Maine held theirs on September 9. They coincided with President Franklin D. Roosevelt 's re-election to an unprecedented third term. His Democratic Party narrowly gained seats from the opposition Republican Party , cementing their majority. However, the election gave firm control of the US House of Representatives and Senate to the New Dealers once again, as Progressives dominated the election.[ 1]
The upswing in the economy that occurred following the Recession of 1937–38 encouraged voters that the New Deal plan had been working. This allowed the Democrats to stabilize their support.
As of 2024, this was the last time the House of Representatives was made up of six parties.
Overall results
↓
267
6
162
Democratic [ b] Republican
Party
Total seats (change)
Seat percentage
Vote percentage
Popular vote
Democratic Party
267
61.3%
51.4%
24,227,821
Republican Party
162
37.2%
45.6%
21,490,392
Progressive Party
3
0.6%
1.0%
477,435
American Labor Party
1
0.2%
0.7%
338,770
Farmer–Labor Party
1
0.2%
0.6%
298,250
Independents
1
0.2%
0.2%
113,497
Communist Party
0
0.0%
0.2%
95,173
Prohibition Party
0
0.0%
0.1%
62,504
Socialist Party
0
0.0%
<0.1%
19,782
Socialist Labor Party
0
0.0%
<0.1%
6,403
Fifteen Dollar Pension Party
0
0.0%
<0.1%
2,418
Liberal Party
0
0.0%
<0.1%
2,256
Fusion Party
0
0.0%
<0.1%
2,014
No Wage Tax Party
0
0.0%
<0.1%
864
Workers Party
0
0.0%
<0.1%
411
Buono Food Plan Party
0
0.0%
<0.1%
375
Peace Party
0
0.0%
<0.1%
341
States' Rights Party
0
0.0%
<0.1%
270
Keep America Neutral Party
0
0.0%
<0.1%
128
Roosevelt New Deal Party
0
0.0%
<0.1%
98
The American Way Party
0
0.0%
<0.1%
65
Others
0
0.0%
<0.1%
5,578
Totals
435
100.0%
100.0%
47,144,845
Source: Election Statistics - Office of the Clerk
Popular vote
American Labor
0.72%
Democratic
51.39%
Farmer–Labor
0.63%
Progressive
1.01%
Republican
45.58%
Others
0.65%
House seats
American Labor
0.23%
Democratic
61.38%
Farmer–Labor
0.23%
Progressive
0.69%
Republican
37.24%
Others
0.23%
Results shaded according to winning candidate's share of the popular vote
House seats by party holding plurality in state 80%+ Republican
80%+ Democratic
60%+ to 80% Republican
60%+ to 80% Democratic
Up to 60% Republican
Up to 60% Democratic
Net gain in states 6+ Democratic gain
6+ Republican gain
3-5 Democratic gain
3-5 Republican gain
1-2 Democratic gain
1-2 Republican gain
1-2 Progressive gain
no net change
Special elections
Many special elections were held. The elected winner would serve only the remainder of the incumbent Congress. Sorted by election date.
District
Incumbent
This race
Member
Party
First elected
Results
Candidates
Michigan 5 Carl Mapes
Republican
1912
Incumbent died December 12, 1939.see below .
Ohio 17 William A. Ashbrook
Democratic
1906 1920 (lost) 1934
Incumbent died January 1, 1940.Republican gain. see below .
Ohio 22 Chester C. Bolton
Republican
1928 1936 (lost) 1938
Incumbent died October 29, 1939.see below .
Iowa 6 Cassius C. Dowell
Republican
1936
Incumbent died February 4, 1940.see below .
Nebraska 1 George H. Heinke
Republican
1938
Incumbent died January 2, 1940.see below .
Maine 2 Clyde H. Smith
Republican
1936
Incumbent died April 8, 1940.see below .
Georgia 8 W. Benjamin Gibbs
Democratic
1938
Incumbent died August 7, 1940.see below .
Alabama 7 William B. Bankhead
Democratic
1916
Incumbent died September 15, 1940.see below .
Colorado 3 John Andrew Martin
Democratic
1908 1912 (retired) 1932
Incumbent died December 23, 1939.see below .
New York 14 William I. Sirovich
Democratic
1926
Incumbent died December 17, 1939.see below .
New York 22 Edward W. Curley
Democratic
1935 (special)
Incumbent died January 6, 1940.see below .
New York 31 Wallace E. Pierce
Republican
1938
Incumbent died January 3, 1940.see below .
Tennessee 9 Walter Chandler
Democratic
1934
Incumbent resigned.see below .
Alabama
Arizona
Results by countyMurdock: 60–70% 70–80% 80–90%
Arkansas
California
Colorado
Connecticut
Delaware
Florida
Georgia
Idaho
Illinois
Indiana
Iowa
Kansas
Kentucky
Louisiana
Several close allies of former governor Huey Long were defeated in primaries by reform candidates.
Maine
Maryland
Massachusetts
Michigan
Minnesota
Mississippi
Missouri
Montana
Nebraska
Nevada
New Hampshire
New Jersey
New Mexico
New York
North Carolina
North Dakota
Ohio
Oklahoma
Oregon
Pennsylvania
Rhode Island
South Carolina
South Dakota
Tennessee
Texas
Utah
Vermont
Virginia
Washington
West Virginia
Wisconsin
Wyoming
Non-voting delegates
After two cycles of electing its delegate in September, Alaska Territory returned to a November election.
See also
Notes
^ September 9, 1940, in Maine
^ There were 1 Independent, 1 Labor, 1 Farmer–Labor, and 3 Progressive.
References
^ CONGRESS: New Houses ^ "Our Campaigns - MI District 05 - Special Election Race - Feb 19, 1940" .^ "OH - District 17 - History" . Our Campaigns. Retrieved July 12, 2018 .^ "OH District 22 - Special Election" . Our Campaigns. Retrieved July 12, 2018 .^ "IA District 6 - Special Election" . Our Campaigns. August 16, 2010. Retrieved November 18, 2019 .^ "NE - District 01 - History" . Our Campaigns. Retrieved December 19, 2017 .^ "ME - District 02 - History" . Our Campaigns. Retrieved December 19, 2017 .^ "GA - District 08 - History" . Our Campaigns. Retrieved December 19, 2017 .^ "AL - District 07 - History" . Our Campaigns. Retrieved July 12, 2018 .^ "CO - District 03 - History" . Our Campaigns. Retrieved July 12, 2018 .^ "Our Campaigns - AK Delegate Race - Nov 05, 1940" .
Elections spanning Elections held
Regulars Odd-year
Elections by state Seat ratings Speaker elections Summaries


