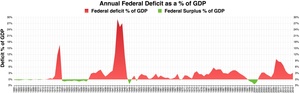
Net worth of the United States by sector as a fraction of GDP 1960–2008Debt in the United StatesProjection of US federal debt as a percentage of GDPAssets of the United States as a fraction of GDP 1960–2008Liabilities of the United States as a fraction of GDP 1960–2009Federal deficits as a percent of GDP
The financial position of the United States includes assets of at least $269 trillion (1576% of GDP) and debts of $145.8 trillion (852% of GDP) to produce a net worth of at least $123.8 trillion (723% of GDP).[a] GDP in Q1 decline was due to foreclosures and increased rates of household saving. There were significant declines in debt to GDP in each sector except the government, which ran large deficits to offset deleveraging or debt reduction in other sectors.[1]
As of 2009, there was $50.7 trillion of debt owed by US households, businesses, and governments, representing more than 3.5 times the annual gross domestic product of the United States.[2] As of the first quarter of 2010, domestic financial assets[b] totaled $131 trillion and domestic financial liabilities $106 trillion.[3] Tangible assets in 2008 (such as real estate and equipment) for selected sectors[c] totaled an additional $56.3 trillion.[5]
Net worth (or equity)
Net worth is the sum of assets (both financial and tangible) minus liabilities for a given sector.[6] Net worth is a valuable measure of creditworthiness and financial health since the calculation includes both financial obligations and the capacity to service those obligations.[7]
The net worth of the United States and its economic sectors has remained relatively consistent over time. The total net worth of the United States remained between 4.5 and 6 times GDP from 1960 until the 2000s, when it rose as high as 6.64 times GDP in 2006, principally due to an increase in the net worth of US households in the midst of the United States housing bubble. The net worth of the United States sharply declined to 5.2 times GDP by the end of 2008 due to declines in the values of US corporate equities and real estate in the wake of the subprime mortgage crisis and the global financial crisis. Between 2008 and 2009, the net worth of US households had recovered from a low of 3.55 times GDP to 3.75 times GDP, while nonfinancial business fell from 1.37 times GDP to 1.22 times GDP.[5]
The net worth of American households and non-profits constitutes three-quarters of total United States net worth – in 2008, 355% of GDP. Since 1960, US households have consistently held this position, followed by nonfinancial business (137% of GDP in 2008) and state and local governments (50% of GDP in 2008). The financial sector has hovered around zero net worth since 1960, reflecting its leverage, while the federal government has fluctuated from a net worth of -7% of GDP in 1946, a high of 6% of GDP in 1974, to -32% of GDP in 2008.[5]
Estimated financial position, Q1 2014
Billions US$
Sector:
Nonfinancial assets:
Financial assets:
Debts:
Net worth:
Household & Nonprofit:
28,329.6 (table B.100, line 2)
67,219 (table L.101, line 1)
13,784.8 (table L.101, line 25)
81,763.8 (table B.100, line 42)
Nonfinancial Corporate Business:
18,511.7 (table B.102, line 2)
16,427.9 (table L.102, line 1)
15,902.2 (table L.102, line 22)
19,094.4 (table B.102, line 33)
Nonfinancial Noncorporate Business:
10,974.6 (table B.103, line 2)
2,909.4 (table L.103, line 1)
5,100.7 (table L.103, line 15)
8,849.7 (table B.103, line 33)
Financial Business:
1,734.1 (table S.6.a, line 102)
82,057.2 (table L.107, line 1)
77,594.8 (table L.107, line 27)
6196.5
State & Local Governments:
9,716.3 (table S.8.a, line 75)
2,909.4 (table L.104, line 1)
5,100.7 (table L.104, line 18)
7525
Federal Government:
3,190.1 (table S.7.a, line 97)
1,727 (table L.105, line 1)
16,415.3 (table L.105, line 15)
-11,498.2
Foreign:
Not available
22,970.8 (table L.106, line 1)
11,045.1 (table L.106, line 25)
11,925.7
Total:
72,456.4
197,226.3 (table L.5, line 33)
145,882.7 (table L.5, line 19)
123,800
All figures from Q1 2014[8] except nonfinancial assets for financial and public sectors, which are from 2013[9]
Some figures are missing land and nonproduced nonfinancial assets.
Gross domestic assets, and related gain (or loss), at end of 2011
Asset (or Capital) Accounts (renamed for clarity) per Federal Reserve Bank ($ trillions)
Current Assets: Currency (10%), Securities (80%), & Receivables (10%) At Market
Fixed Assets: Structures, Hardware, & Software At Market
Debt Capital At Market
Equity Capital At Market
Total Assets (or Capital) At Market
Percent of Assets
Percent Gain (or Loss) in Assets
Households (& Non-Profits)
50.23
23.39
13.48
60.04
73.52
33.82%
Corporate (Big) Businesses
15.07
14.97
13.74
16.31
30.04
13.82%
Other (Small) Businesses
3.47
9.52
5.56
7.43
13.00
5.98%
Financial Businesses
65.97
1.67
62.34
5.30
67.64
31.1%
Foreign Investors
18.25
11.04
7.21
18.25
8.39%
Private Account Totals
152.99
49.45
106.16
96.28
202.44
93.12%
State & Local Government
2.52
8.90
3.72
7.71
11.42
5.25%
Federal Government
1.35
2.18
12.26
-8.73
3.53
1.62%
Public Account Totals
3.87
11.08
15.98
-1.02
14.95
6.68%
Gross Account Totals
156.86
60.53
122.14
95.26
217.14
100%
Less: 2010 Total Assets
-212.20
2011 Total Asset Gain
5.20
2.45%
Less: 2011 Inflation
-3.20%
2011 Real Asset Loss
-0.75%
SOURCE: Federal Reserve Bank Z-1 Flow of Funds Statement, End of 2011 Accounts[10]
Gross domestic income for 2010
Income Accounts (renamed & reclassified for clarity) per Bureau of Economic Analysis ($ trillions)
Gross Domestic Income Components
Gross Domestic Income Percentage
Private Employee Wages
6.31
43.43%
Private Gross Profits
5.23
36.01%
Gross Private Income (or Value Added)
11.54
79.44%
Public Employee Wages
1.67
11.50%
Public Gross Profits
1.32
9.05%
Gross Public Income (or Taxes Added)
2.99
20.56%
Gross Domestic Income (or GDI)
14.53
100%
SOURCE: U.S. Bureau of Economic Analysis, 2010 Accounts[11]
Gross domestic expense for 2010
Expense Accounts (renamed for clarity) per Bureau of Economic Analysis ($ trillions)
Gross Domestic Expense Components
Gross Domestic Expense Percentage
Consumer Service Purchases
6.85
47.25%
Consumer Product Purchases
2.29
15.76%
Consumer Durable Investments
1.08
7.44%
Individual Domestic Expense
10.22
70.46%
Business Hardware Investments
1.02
7.04%
Business Structure Investments
0.38
2.60%
Residential Structure Investments
0.34
2.35%
Business Domestic Expense
1.74
11.98%
Federal Defense Purchases/Investments
0.82
5.64%
Other Federal Purchases/Investments
0.41
2.80%
State/Local Purchases/Investments
1.83
12.65%
Government Domestic Expense
3.06
21.09%
Imported Product Purchases
-1.95
-13.43%
Imported Service Purchases
-0.41
-2.82%
Exported Product Purchases
1.28
8.82%
Exported Service Purchases
0.57
3.90%
Net Trade Loss (or Deficit)
-0.51
-3.53%
Gross Domestic Expense (or GDP)
14.50
99.81%
Statistical Discrepancy (Income > Expense)
0.03
0.19%
Equals: Gross Domestic Income (above)
14.53
100.00%
SOURCE: U.S. Bureau of Economic Analysis, 2010 Accounts[12]
Debt
Federal Government debtConsumer and Government debt in the United StatesConsumer and Government Debt as a % of GDPComponents of total US debt as a fraction of GDP 1945-2009US interest payments on debt by sector as a fraction of GDP 1960-2008
Credit market debt by sector and asset class (2010 Q1) owed by the United States in billions USD[13]
The Federal Reserve issues routine reports on the flows and levels of debt in the United States. As of the first quarter of 2010, the Federal Reserve estimated that total public and private debt owed by American households, businesses, and government totaled $50 trillion, or roughly $175,000 per American and 3.5 times GDP.[13]
Interest payments on debt by US households, businesses, governments, and nonprofits totaled $3.29 trillion in 2008. The financial sector paid an additional $178.6 billion in interest on deposits.[14]
In 1946, the total US debt-to-GDP ratio was 150%, with two-thirds of that held by the federal government. Since 1946, the federal government's debt-to-GDP ratio has since fallen by nearly half, to 54.8% of GDP in 2009. The debt-to-GDP ratio of the financial sector, by contrast, has increased from 1.35% in 1946 to 109.5% of GDP in 2009. The ratio for households has risen nearly as much, from 15.84% of GDP to 95.4% of GDP.[2]
In April 2011, International Monetary Fund said that, "The US lacks a "credibility strategy" to stabilise its mounting public debt, posing a small but significant risk of a new global economic crisis.[15]
Financial sector
In 1946, the US financial sector owed $3 billion of debt, or 1.35% of GDP. By 2009 this had increased to $15.6 trillion, or 109.5% of GDP.[2]
Most debt owed by the US financial sector is in the form of federal government sponsored enterprise (GSE) issues and agency-backed securities.[16] This refers to securities guaranteed and mediated by federal agencies and GSEs such as Ginnie Mae, Fannie Mae, and Freddie Mac, among others. This group also includes the mortgage pools that are used as collateral in collateralized mortgage obligations.[17] The proportion of financial sector debt owed in the form of GSE and federally related mortgage pools has remained relatively constant – $863 million or 47% of total financial sector debt in 1946 was in such instruments; this has increased to 57% of financial sector debt in 2009, although this now represents over $8 trillion.[16]
Bonds represent the next largest part of financial sector debt. In 1946, bonds represented 6% of financial sector debt, but by 1953 this proportion had risen to 24%. This remained relatively constant until the late 1970s; bonds fell to 14% of financial sector debt in 1981.[16] This coincided with Federal Reserve chairmanPaul Volcker's strategy of combating stagflation by raising the federal funds rate; as a result the prime rate peaked at 21.5%, making financing through credit markets prohibitively expensive.[18] Bonds recovered in the 1980s, representing approximately 25% of financial sector debt throughout the 1990s; however, between 2000 and 2009, bonds issued by the financial sector had increased to 37% of financial sector debt, or $5.8 trillion.[16]
Bonds and GSE/federal agency-backed issues represent all but 12% of financial sector debt in 2009.[16]
Households and non-profits
In 1946, US households and non-profits owed $35 billion of debt or 15.8% of GDP. By 2009 this figure had risen to $13.6 trillion or 95.4% of GDP.[2]Home mortgage debt in 1946 represented 66.5% of household debt; consumer credit represented another 24%. By 2009, home mortgage debt had risen to 76% of household debt and consumer credit had fallen to 18.22%.[19] According to the McKinsey Global Institute, the 2008 financial crisis was caused by "unsustainable levels of household debt." The ratio of debt to household income rose by about one-third from 2000 to 2007.[20] The US currently has the twelfth highest debt to GDP ratio among advanced economies.[20]
Nonfinancial business
In 1946, US nonfinancial businesses owed $63.9 billion of debt or 28.8% of GDP. By 2009 this figure had risen to $10.9 trillion or 76.4% of GDP.[2]
State and local governments
Public debt percent of GDP
In 1946, US state and local governments owed $12.7 billion of debt or 5.71% of GDP. By 2009 this figure had risen to $2.4 trillion or 16.5% of GDP.[2]
In 2016, state and local governments owed $3 trillion and have another $5 trillion in unfunded liabilities.[21]
State and local governments have significant financial assets, totaling $2.7 trillion in 2009. In 2009, these included $1.3 trillion in credit market debt (that is, debt owed by other sectors to state and local governments). These figures do not include state and local retirement funds.[22] State and local retirement funds held $2.7 trillion in assets at the end of 2009.[23]
In 1946, the federal government owed $251 billion of debt or 102.7% of GDP. By 2009 this figure had risen to $7.8 trillion, but the federal government's debt-to-GDP ratio had fallen to 54.75%.[2]
The federal government held $1.4 trillion in assets at the end of 2009. This is more than double the assets held by the federal government in 2007 ($686 billion), mainly due to the acquisition of corporate equities, credit market debt, and cash. The federal government held $223 billion in corporate equity at the beginning of 2009; this had fallen to $67.4 billion at the end of that year.[22]
These figures do not include federal government retirement funds. Federal government retirement funds held $1.3 trillion in assets at the end of 2009.[24]
A timeline showing projected debt milestones from the CBO
These figures also do not include debt that the federal government owes to federal funds and agencies such as the Social Security Trust Fund. It also does not include "unfunded liabilities" to entitlement programs such as Social Security and Medicare either as debt or accounting liabilities.[25] According to official government projections, the Medicare is facing a $37 trillion unfunded liability over the next 75 years, and the Social Security is facing a $13 trillion unfunded liability over the same time frame.[26]
Negative real interest rates
Since 2010, the U.S. Treasury has been obtaining negative real interest rates on government debt.[27] Such low rates, outpaced by the inflation rate, occur when the market believes that there are no alternatives with sufficiently low risk, or when popular institutional investments such as insurance companies, pensions, or bond, money market, and balanced mutual funds are required or choose to invest sufficiently large sums in Treasury securities to hedge against risk.[28][29]Lawrence Summers, Matthew Yglesias and other economists state that at such low rates, government debt borrowing saves taxpayer money, and improves creditworthiness.[30][31] In the late 1940s through the early 1970s, the US and UK both reduced their debt burden by about 30% to 40% of GDP per decade by taking advantage of negative real interest rates, but there is no guarantee that government debt rates will continue to stay so low.[28][32] In January, 2012, the U.S. Treasury Borrowing Advisory Committee of the Securities Industry and Financial Markets Association unanimously recommended that government debt be allowed to auction even lower, at negative absolute interest rates.[33]
Derivatives
Derivative contracts outstanding (2010 Q1) in billions USD[34]
The number commonly used by the media is notional value, which is a base value used to determine the size of the cash flows exchanged in the contract.[37] Fair value (or market value) is the value of the contract either on the open market or as it is appraised by accountants. Fair value can be positive or negative depending on the side of the contract the party is on.[36] Credit exposure is defined as the net loss which holders of derivatives would suffer if their counterparties in those derivatives contracts defaulted.[35]
The notional value of derivative contracts held by US financial institutions is $216.5 trillion, or more than 15 times US GDP.[34]
The fair value of US-held derivatives contracts in the first quarter of 2010 was $4,002 billion (28.1% of GDP) for positions with positive values (known as "derivatives receivables"), and $3,886 for positions with negative values (27.3% of GDP).[36]Interest rate derivatives form by far the largest part of US derivative contracts by all measures, accounting for $3,147 billion or 79% of derivatives receivables.[35]
The measure preferred by the Office of the Comptroller is net current credit exposure (NCCE), which measures the risk to banks and the financial system in derivatives contracts. The net current credit exposure (NCCE) of American financial institutions to derivatives in the first quarter of 2010 to $359 billion or 2.5% of GDP, down from $800 billion at the end of 2008 in the wake of the global financial crisis, when it stood at 5.5% of GDP. The difference between the market value of US derivatives and the credit exposure to the financial system is due to netting – financial institutions tend to have many positions with their counterparties that have positive and negative values, resulting in a much smaller exposure than the sum of the market values of their derivative positions.[35] Netting reduces the credit exposure of the US financial system to derivatives by more than 90%, as compared to 50.6% at the beginning of 1998.[38]
Derivatives contracts are overwhelmingly held by large financial institutions. The five largest US banks hold 97% of derivatives by notional value; the top 25 hold nearly 100%.[38] Banks currently hold collateral against their derivative exposures amounting to 67% of their net current credit exposure.[39]
Foreign debt, assets, and liabilities
Foreign-owned US assets and US-owned foreign assets (2010 Q1) in billions USD[40]
Foreign holdings of US assets are concentrated in debt. Americans own more foreign equity and foreign direct investment than foreigners own in the United States, but foreigners hold nearly four times as much US debt as Americans hold in foreign debt.
15.2% of all US debt is owed to foreigners.[13] Of the $7.9 trillion Americans owe to foreigners, $3.9 trillion is owed by the federal government. 48% of US treasury securities are held by foreigners.[41] Foreigners hold $1.28 trillion in agency- and government sponsored enterprise-backed securities, and another $2.33 trillion in US corporate bonds.[40]
Foreigners hold 24% of domestic corporate debt[42] and 17% of domestic corporate equity.[43]
Sectoral financial balances in U.S. economy 1990-2012. By definition, the three balances must net to zero. Since 2009, the U.S. capital surplus and private sector surplus have driven a government budget deficit.
Economist Martin Wolf explained in July 2012 that government fiscal balance is one of three major financial sectoral balances in the U.S. economy, the others being the foreign financial sector and the private financial sector. The sum of the surpluses or deficits across these three sectors must be zero by definition. In the U.S., a foreign financial surplus (or capital surplus) exists because capital is imported (net) to fund the trade deficit. Further, there is a private sector financial surplus due to household savings exceeding business investment. By definition, there must therefore exist a government budget deficit so all three net to zero. The government sector includes federal, state and local. For example, the government budget deficit in 2011 was approximately 10% GDP (8.6% GDP of which was federal), offsetting a capital surplus of 4% GDP and a private sector surplus of 6% GDP.[44]
Wolf argued that the sudden shift in the private sector from deficit to surplus forced the government balance into deficit, writing: "The financial balance of the private sector shifted towards surplus by the almost unbelievable cumulative total of 11.2 per cent of gross domestic product between the third quarter of 2007 and the second quarter of 2009, which was when the financial deficit of US government (federal and state) reached its peak...No fiscal policy changes explain the collapse into massive fiscal deficit between 2007 and 2009, because there was none of any importance. The collapse is explained by the massive shift of the private sector from financial deficit into surplus or, in other words, from boom to bust."[44]
Economist Paul Krugman also explained in December 2011 the causes of the sizable shift from private deficit to surplus: "This huge move into surplus reflects the end of the housing bubble, a sharp rise in household saving, and a slump in business investment due to lack of customers."[45]
^Domestic financial assets and liabilities are calculated as total assets and liabilities (table L.5) minus foreign assets and liabilities (table L.107)
^This figure does not include the tangible assets of farm business.[4]
^Roxburgh, Charles; Lund, Susan; Daruvala, Toos; Manyika, James; Dobbs, Richard; Forn, Ramon; Croxson, Karen (January 2012). Debt and De-leveraging: Uneven Progress on the Path to Growth (Report). McKinsey Global Institute. Retrieved March 24, 2013.
^ abDobbs, Richard; Lund, Susan; Woetzel, Jonathan; Mutafchieva, Mina (February 2015). "Debt and (not much) deleveraging". McKinsey Global Institute. Archived from the original on January 17, 2016. Retrieved January 15, 2015. {{cite journal}}: Cite journal requires |journal= (help)
^ abCarmen M. Reinhart and M. Belen Sbrancia (March 2011) "The Liquidation of Government Debt" National Bureau of Economic Research working paper No. 16893
SeñoritaSingel oleh Shawn Mendes dan Camila Cabellodari album Shawn MendesDirilis21 Juni 2019 (2019-06-21)Format 7-inch vinyl kaset singel CD unduhan digital picture disc streaming DirekamMei 2019[1]GenreLatin popDurasi3:11LabelIslandRepublicPencipta Shawn Mendes Camila Cabello Andrew Wotman Benjamin Levin Ali Tamposi Charlotte Emma Aitchison Jack Patterson Magnus August Høiberg Produser Andrew Watt Benny Blanco Cashmere Cat Kronologi singel Shawn Mendes If I Can't Have You (…
Daftar pustaka Stephen King Terbitan ↙Buku 5 ↙Novel 56 ↙Cerita 8 ↙Pamflet 1 ↙Naskah 1 Berikut ini adalah daftar lengkap buku yang ditulis oleh Stephen King. Untuk karya cerita pendek, lihat Bibliografi fiksi pendek Stephen King. Untuk karya yang tidak diterbitkan, lihat karya Stephen King yang tidak diterbitkan. Buku-buku yang berkaitan dengan seri The Dark Tower (baik karakter, tempat, atau peristiwa) ditandai dengan †. Karya yang berkaitan sedikit ataupun memiliki referensi te…
Battaglia Passo Uarieuparte della Guerra di EtiopiaData21-24 gennaio 1936(3 giorni) LuogoPasso Uarieu, Tembien (Etiopia) EsitoVittoria italiana Schieramenti Italia Impero d'Etiopia ComandantiUmberto SommaFilippo Diamantiras Cassa Effettivi3.000 uominicirca 20.000 uomini Perdite1.082 uomini8.000 uomini Voci di battaglie presenti su Wikipedia Manuale V · D · MGuerra d'Etiopia(1935-1936)Incidente di Ual Ual Offensiva di De Bono – Offensiva etiope di Natale – G…
Constellation Observing System for Meteorology, Ionosphere, and Climate (COSMIC) adalah program yang dirancang untuk memberikan kemajuan dalam meteorologi, penelitian ionosfer, klimatologi, dan cuaca ruang dengan menggunakan satelit GPS dalam hubungannya dengan satelit orbit Bumi rendah (LEO). Istilah Cosmic bisa merujuk ke salah satu organisasi itu sendiri atau konstelasi satelit (juga dikenal sebagai FORMOSAT-3, 福爾摩沙衛星三號, di Taiwan). Rasi bintang ini adalah proyek AS-Taiwan ber…
Wali Kota Administrasi Jakarta BaratPetahanaUus Kuswantosejak 21 Maret 2023Dibentuk1966Pejabat pertamaR. Sudardja Berikut adalah artikel tentang Daftar Wali Kota Administrasi Jakarta Barat, satu wilayah administrasi di provinsi Daerah Khusus Ibukota Jakarta, Indonesia dari masa ke masa sejak dibentuk tahun 1966. No. Foto Nama Mulai menjabat Akhir menjabat Ket. Wakil 1 R. Sudardja 1966 1972 – 2 S. Silalahi 1972 1979 3 Eddy Ruchijat Soheh 1979 1987 4 Sudjoko Tirtowidjojo 1987 1993 5 Sutardj…
LogaritmaDomain dan CitraDomain dari fungsi ( 0 , ∞ ) {\displaystyle (0,\infty )} Daerah hasil fungsi ( − ∞ , ∞ ) {\displaystyle (-\infty ,\infty )} Nilai-nilai spesifikNilai di + ∞ {\displaystyle +\infty } ∞ {\displaystyle \infty } Nilai maksimumTidak adaNilai minimumTidak adaSifat khususAkar 1 {\displaystyle 1} Invers x = b y {\displaystyle x=b^{y}} Turunan 1 x ln b {\displaystyle {\frac {1}{x\ln b}}} Antiturunan x log b x − x …
Ini adalah nama Korea; marganya adalah Lee. Lee Kun-heeLee dalam acara sarapan bersama dengan berbagai pemimpin bisnis tahun 2013Lahir(1942-01-09)9 Januari 1942Ŭiryŏng, Kyŏngsang Selatan, Korea Selatan[1]Meninggal25 Oktober 2020(2020-10-25) (umur 78)[2]Samsung Medical Center, Seoul, Korea SelatanKebangsaan Korea SelatanAlmamater Universitas Waseda Universitas George Washington PekerjaanPimpinan SamsungKekayaan bersih US$18,7 miliar (Februari 2020)[3]Suam…
Ada Cinta Di SMASutradaraPatrick EffendyProduserChand Parwez ServiaFiaz ServiaSkenarioHaqi AchmadPatrick EffendyCeritaSalman AristoPemeranIqbaal RamadhanCaitlin HaldermanTeuku RyzkiAgatha ChelseaAlvaro MaldiniGege ElisaCassandra LeePenata musikCJRAndhika TriyadiSinematograferDicky R. MalandPenyuntingAline JusriaPerusahaanproduksiStarvision PlusDistributorStarvision PlusTanggal rilis 6 Oktober 2016Negara IndonesiaBahasaBahasa IndonesiaPendapatankotorRp 11,9 miliar Ada Cinta Di SMA adalah fi…
Gerbang kampus dilihat dari Chimney Jesus College adalah salah satu dari 31 perguruan tinggi Universitas Cambridge di Britania Raya. Nama lengkap perguruan tinggi itu adalah The College of the Blessed Virgin Mary, Saint John the Evangelist and the glorious Virgin Saint Radegund, near Cambridge. Nama umumnya berasal dari nama kapelnya, kapel perguruan tinggi Yesus. Jesus College didirikan pada 1496[1] di situs biara Benediktin abad ke-XII St Maria dan St Radegonda oleh John Alcock, yang s…
2018-2019 DC Comics crossover event Heroes in CrisisCover of Heroes in Crisis #1 (September 26, 2018). Art by Clay Mann.Publication informationPublisherDC ComicsFormatLimited seriesGenreSuperheroPublication dateSeptember 2018 – May 2019No. of issues9Main character(s)BatmanBooster GoldFlash (Wally West)Harley QuinnSupermanWonder WomanCreative teamWritten byTom KingPenciller(s)Clay MannMitch GeradsTravis MooreLee WeeksJorge Fornés Heroes in Crisis is an American comic book limite…
Cinte Tesino commune di Italia Cinte Tesino (it) Tempat categoria:Articles mancats de coordenades Negara berdaulatItaliaRegion otonom dengan status khususTrentino-Tirol SelatanProvinsi di ItaliaTrentino NegaraItalia Ibu kotaCinte Tesino PendudukTotal368 (2023 )GeografiLuas wilayah30,3 km² [convert: unit tak dikenal]Ketinggian851 m Berbatasan denganCastello Tesino Grigno Lamon Ospedaletto Pieve Tesino Scurelle Canal San Bovo SejarahSanto pelindungLaurensius Informasi tambahanKode pos3…
A decision based design structure, which spans the areas of engineering design, design rationale and decision analysis Information mapping Topics and fields Business decision mapping Data visualization Graphic communication Infographics Information design Knowledge visualization Mental model Morphological analysis Ontology (information science) Schema (psychology) Visual analytics Visual language Node–link approaches Argument map Cladistics Cognitive map Concept lattice Concept map Conceptual …
وست وينفيلد الإحداثيات 42°53′04″N 75°11′31″W / 42.884444444444°N 75.191944444444°W / 42.884444444444; -75.191944444444 [1] تقسيم إداري البلد الولايات المتحدة[2] التقسيم الأعلى مقاطعة هيركايمر خصائص جغرافية المساحة 2.360046 كيلومتر مربع2.360049 كيلومتر مربع (1 أبريل 2010) ارتفاع 363…
Welcome Welcome! (We can't say that loud/big enough!) Here are a few links you might find helpful: Be Bold! Don't let grumpy users scare you off. Meet other new users Learn from others Play nice with others Contribute, Contribute, Contribute! Tell us about you If you have any questions or problems, no matter what they are, leave me a message on my talk page. We're so glad you're here! -- Essjay · Talk 09:07, July 12, 2005 (UTC) Columbine Talk Page Hello, I just read your post on the talk page. …
Old Washington County Courthouse in the village of West Kingston West Kingston is an unincorporated village and traditional county seat of Washington County, Rhode Island. It is the site of the Kingston Railroad Station Amtrak station, and is a part of the Town of South Kingstown. Overview Although unincorporated, West Kingston has a post office and recognized mailing address location. It shares ZIP code 02892 with much of western South Kingstown, a large portion of Richmond, Rhode Island to the…
La radio FM, inventée en 1933 par Edwin Armstrong, est un procédé de radiodiffusion de programmes radiophoniques en modulation de fréquence (ou FM pour Frequency Modulation) dans la gamme des très hautes fréquences (VHF, Very High Frequency). Elle est destinée à être reçue directement par le public et s'applique à la fois à la réception individuelle et à la réception communautaire[1]. Dans la plupart des pays, c'est plus précisément la bande 87,5 – 108 MHz (VHF – bande II) q…
Chandler, ArizonaKotaPusat kota Chandler LambangLokasi di County Maricopa dan wilayah ArizonaNegaraAmerika SerikatNegara bagianArizonaCountyMaricopaDidirikan17 Mei 1912Pemerintahan • Wali kotaJay TibshraenyLuas • Total64,58 sq mi (150,2 km2) • Luas daratan57,9 sq mi (149,9 km2) • Luas perairan0,1 sq mi (0,3 km2)Ketinggian1.214 ft (370 m)Populasi (2010)[1][2] • T…
Window in the ceiling-roof This article is about roof windows. For other uses, see Skylight (disambiguation). Skylight in the rotunda of Centro Cultural Banco do Brasil in Rio de Janeiro. Oculus of the Pantheon, Rome, an open skylight. Skylight in the vault in the Chapel of the Constable of the Burgos Cathedral, a glazed closed skylight from the 15th century A skylight (sometimes called a rooflight) is a light-permitting structure or window, usually made of transparent or translucent glass,[…


")


")

")


